
Help & Documentation
Table of Contents
AMR Prediction
How to Make a Prediction
Navigate to the Prediction Page
From the main dashboard, click on "AMR Prediction" in the navigation menu on the left sidebar. This will take you to the AMR prediction interface.
Select the Bacterial Genus and Upload Your Genome File
Use the dropdown menu to select the genus of your bacterial isolate. The available genera are:
- Escherichia (e.g., E. coli)
- Klebsiella
- Acinetobacter
- Pseudomonas
- Enterobacter
- Staphylococcus
Click the "Click to upload" button or drag and drop your genome file into the upload area. The system accepts FASTA format files (.fna, .fasta, .fa).
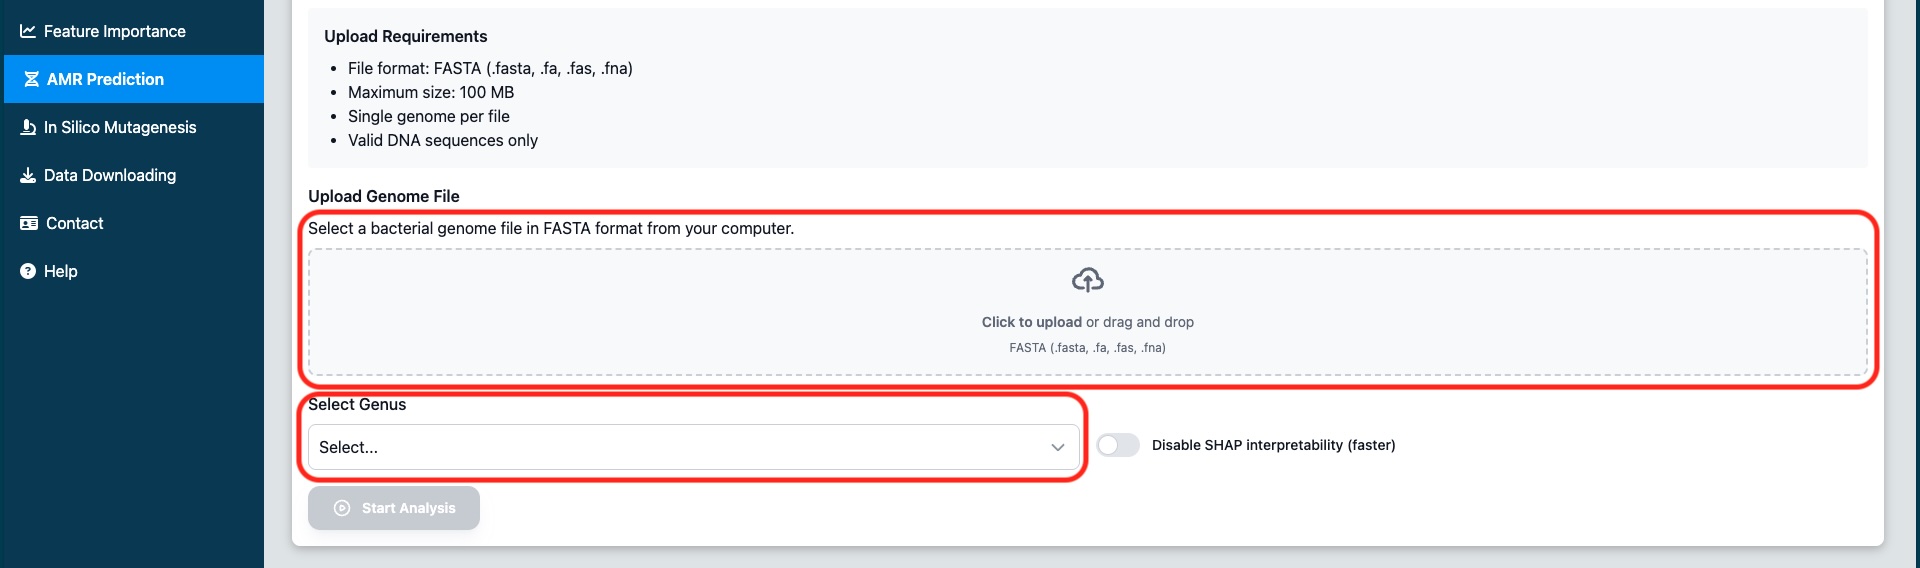
Figure 1: Select the bacterial genus from the dropdown menu and upload your genome file using the file selector or drag-and-drop
Configure SHAP Analysis (Optional)
By default, SHAP (SHapley Additive exPlanations) analysis is enabled. This provides interpretability for the predictions by showing which genomic features contributed most to each prediction.
If you want faster results and don't need feature importance analysis, you can check the "Disable SHAP Analysis" checkbox.
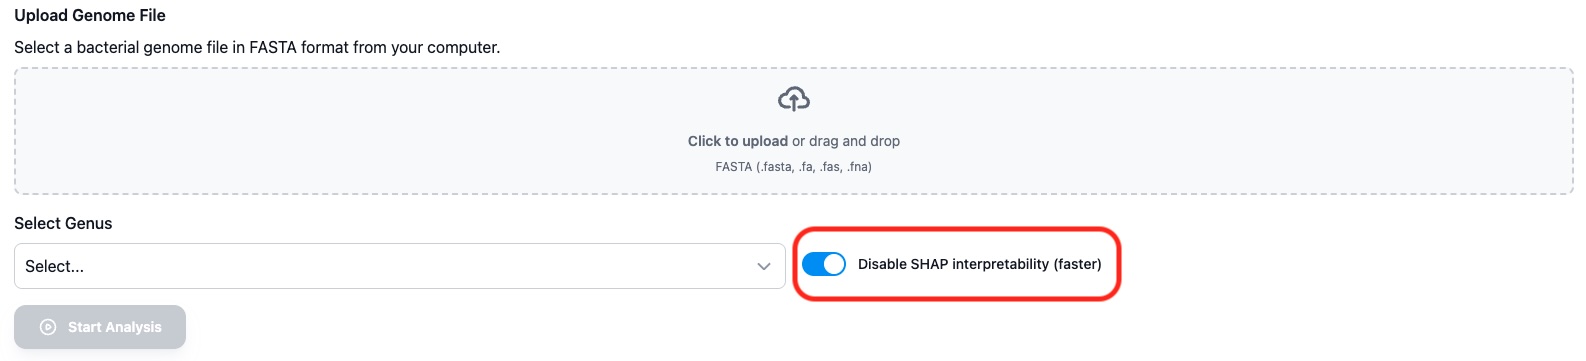
Figure 2: Toggle SHAP analysis on or off based on your needs
Start the Analysis
Once you've selected the genus and uploaded your file, click the "Start Analysis" button. The system will begin processing your genome.
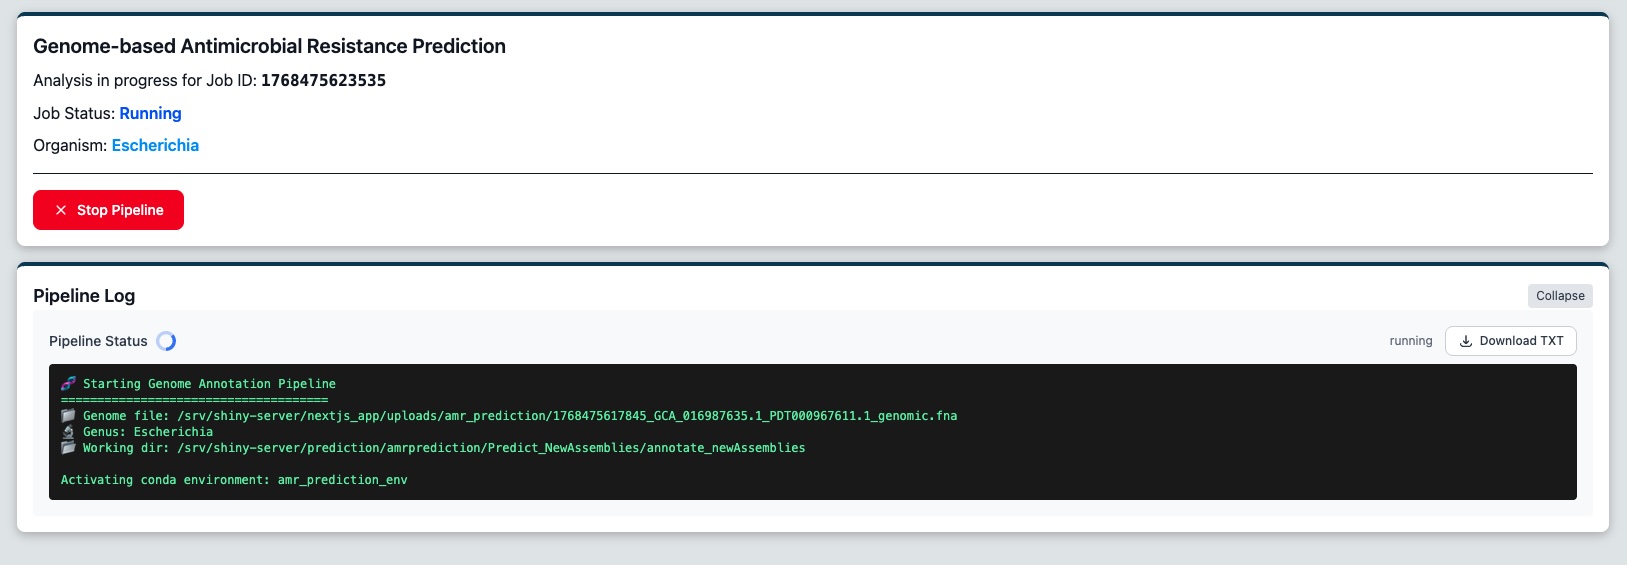
Figure 3: The job status page, until the analysis is complete
You will be redirected to a job status page where you can monitor the progress of your analysis in real-time. The job page displays a real-time log of the analysis pipeline. You'll see status updates as the system:
- Extracts k-mers from your genome
- Runs predictions for each antibiotic
- Generates SHAP values (if enabled)
View Results
Once the analysis is complete, the results table will appear showing predictions for each antibiotic. Each row displays:
- Antibiotic name
- Prediction (Resistant or Susceptible)
- Confidence score (shown as a percentage bar)
- SHAP analysis link (if enabled)
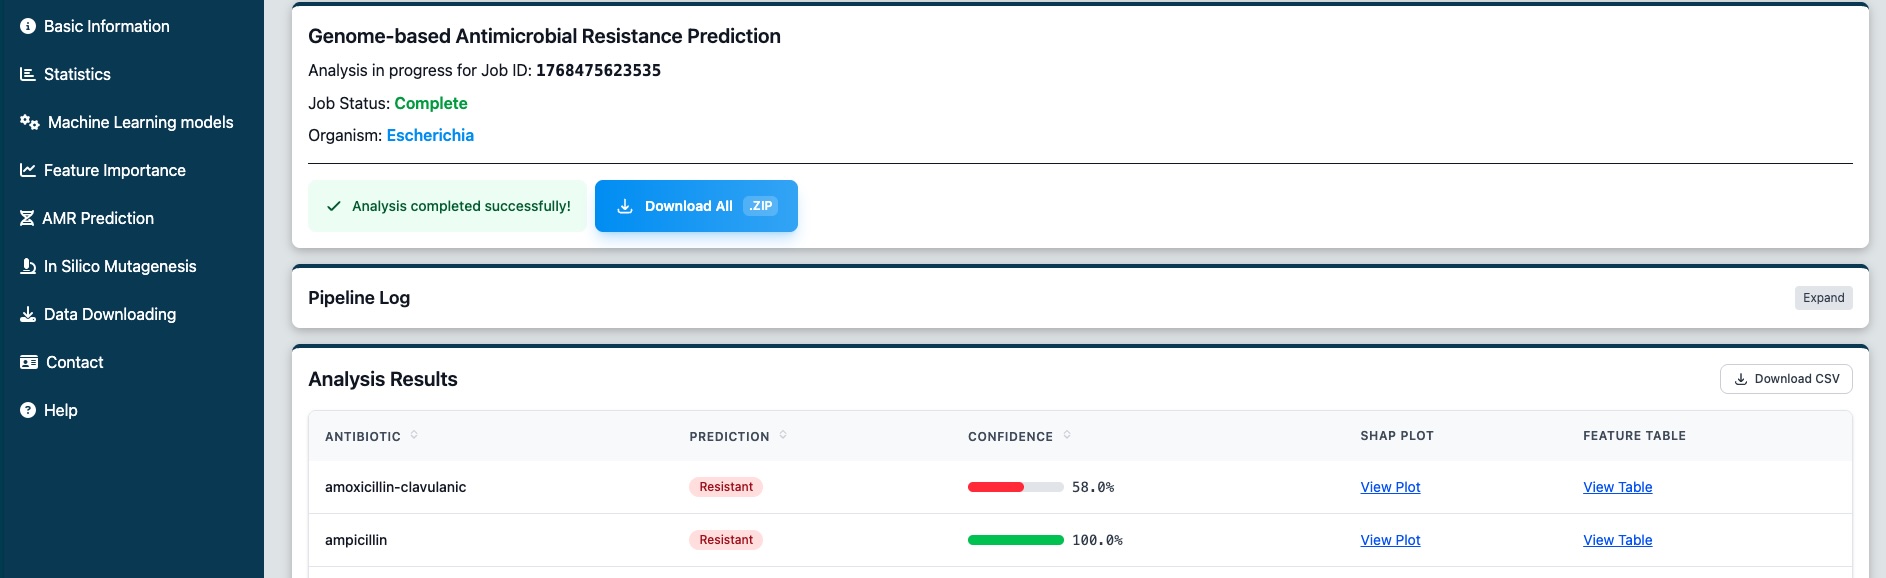
Figure 4: View the AMR prediction results for all tested antibiotics
Understanding Your Results
Prediction Categories
Confidence Scores
The confidence bar indicates how certain the model is about its prediction:
File Requirements
| Requirement | Details |
|---|---|
| File Format | FASTA (.fna, .fasta, .fa) |
| Content | Assembled genome contigs or complete genome |
| Quality | High-quality assembly recommended for best results |
| Maximum Size | 100 MB per file |
Supported Genera
Escherichia
AMR prediction models trained on clinical isolates
Klebsiella
AMR prediction models trained on clinical isolates
Acinetobacter
AMR prediction models trained on clinical isolates
Pseudomonas
AMR prediction models trained on clinical isolates
Enterobacter
AMR prediction models trained on clinical isolates
Staphylococcus
AMR prediction models trained on clinical isolates
SHAP Analysis Explained
SHAP (SHapley Additive exPlanations) is a method to explain individual predictions by computing the contribution of each feature to the prediction. In the context of AMR prediction, SHAP values show which k-mers (short DNA sequences) contributed most to classifying an isolate as resistant or susceptible.
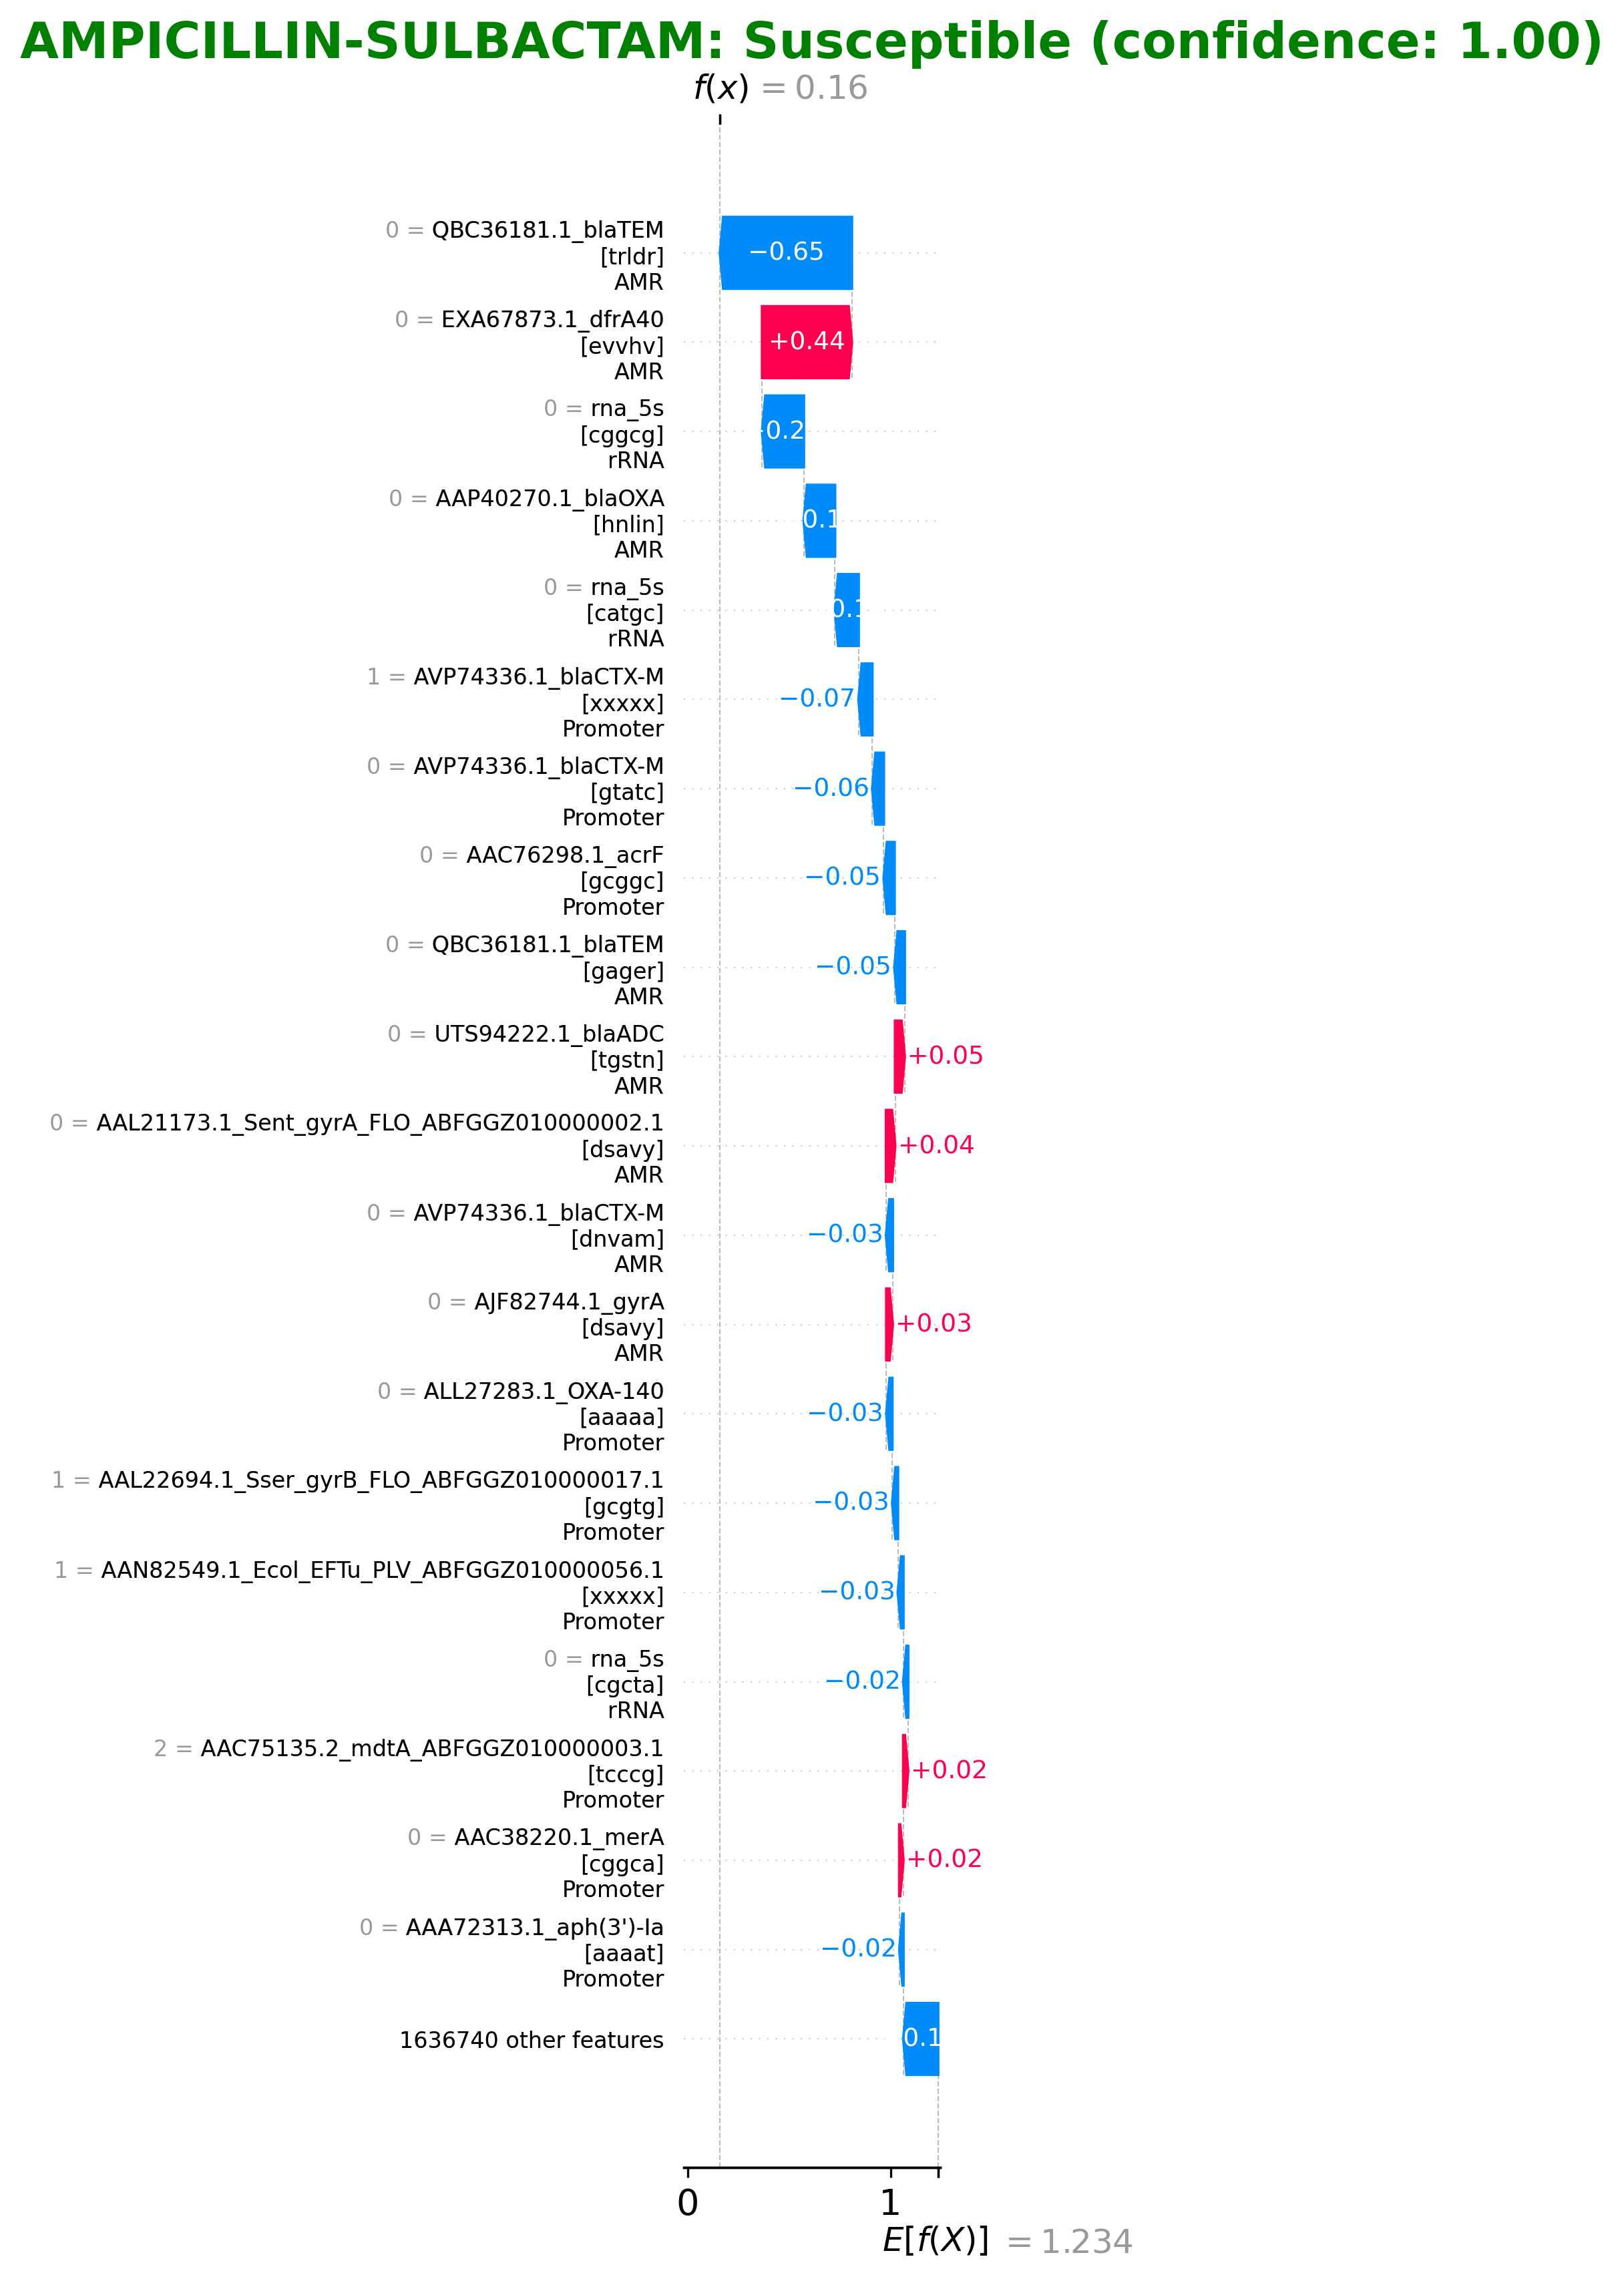
Figure 5: Example SHAP waterfall plot showing feature contributions
How to Interpret SHAP Values
- +Positive values (red): Features that push the prediction toward "Resistant"
- −Negative values (blue): Features that push the prediction toward "Susceptible"
- |Bar length: The magnitude of the feature's contribution to the prediction
What is In Silico Mutagenesis?
In Silico Mutagenesis is a computational feature analysis tool that allows you to explore how the presence or absence of specific genomic features (k-mers) affects antimicrobial resistance predictions without performing actual laboratory experiments. By modifying which features are considered "present" in your genome, you can observe how the model's predictions change for different antibiotics.
Extract Features
Identify important k-mers and genes in your genome
Toggle Presence
Simulate adding or removing genes/k-mers
Compare Results
See how changes affect resistance predictions
How to Run Mutagenesis Analysis
Navigate to In Silico Mutagenesis
From the sidebar, click on "In Silico Mutagenesis" (microscope icon). This opens the mutagenesis feature analysis interface.
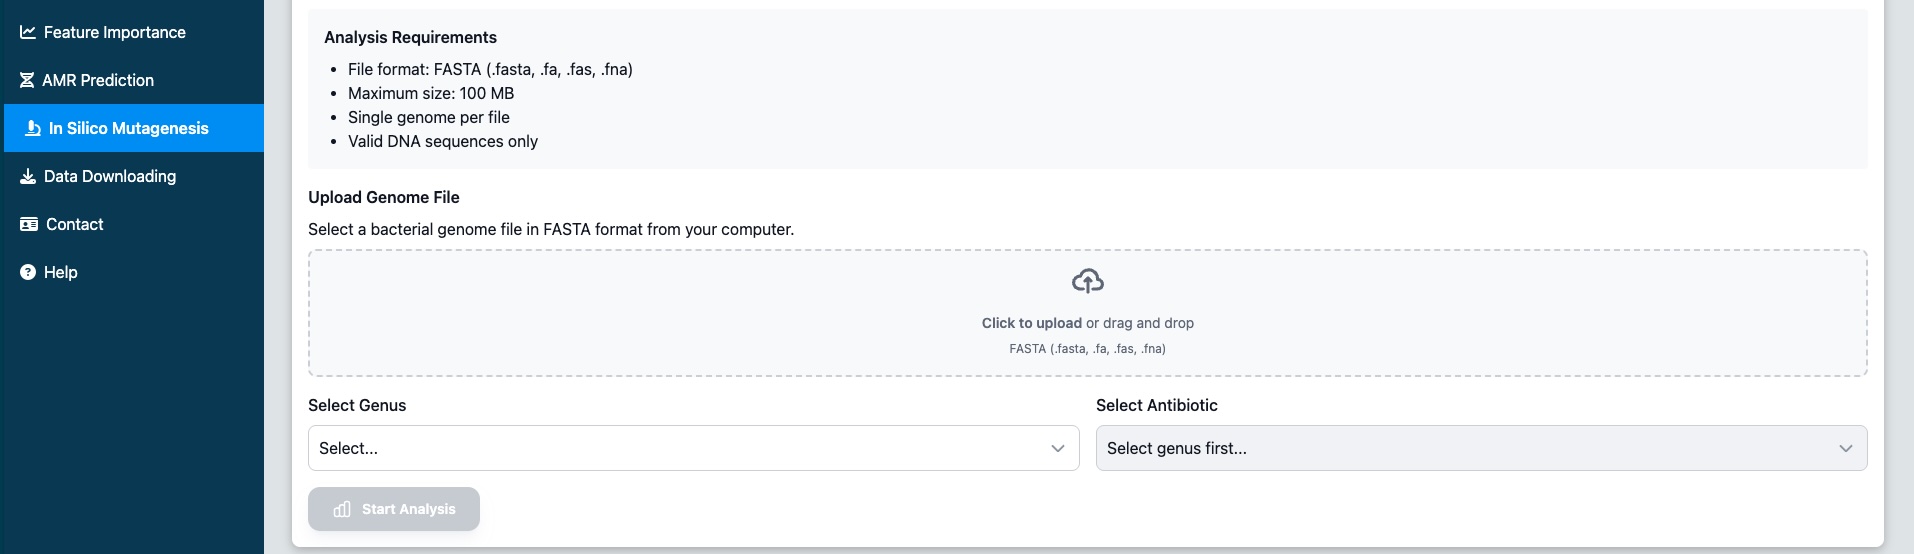
Figure 6: Access In Silico Mutagenesis from the sidebar navigation
Upload Genome and Select Parameters
Configure your analysis by:
- Upload a genome file - FASTA format (.fasta, .fa, .fas, .fna), max 100 MB
- Select the bacterial genus - Same options as AMR prediction (Escherichia, Klebsiella, Acinetobacter, Pseudomonas, Enterobacter, Staphylococcus)
- Select a target antibiotic - The available antibiotics will depend on the selected genus
Start Feature Extraction
Click "Start Analysis" to begin the feature extraction process. The system will:
- Extract important k-mers from your genome
- Map features to known genes and genomic regions
- Calculate importance scores for each feature
- Determine feature direction (Protective vs Risk)
Processing typically takes 1-5 minutes.
Review Extracted Features
Once analysis is complete, you'll see a table of extracted features showing:
| Column | Description |
|---|---|
| Gene | The gene or genomic region associated with this k-mer |
| Sequence | The actual k-mer DNA sequence |
| Type | Feature type (Gene, Intergenic, promoter, rRNA, protein) |
| Importance | How strongly this feature contributes to the prediction |
| Direction | Protective (toward susceptible) or Risk (toward resistant) |
| Present | Whether this feature is currently present in your genome |
You can download this data as a CSV file using the "Download CSV" button.
Modify Features and Run Prediction
Click the "In Silico Mutagenesis" button to open the modification modal. Here you can:
- Gene Types tab - Modify all k-mers for a gene at once using "All Present" or "All Absent" buttons
- Individual K-mers tab - Toggle presence for specific k-mers using the dropdown
- Search - Filter features by gene name or sequence
- Sort - Click column headers to sort by importance, presence, etc.
When ready, click "Run Prediction" to see how your modifications affect the AMR predictions.
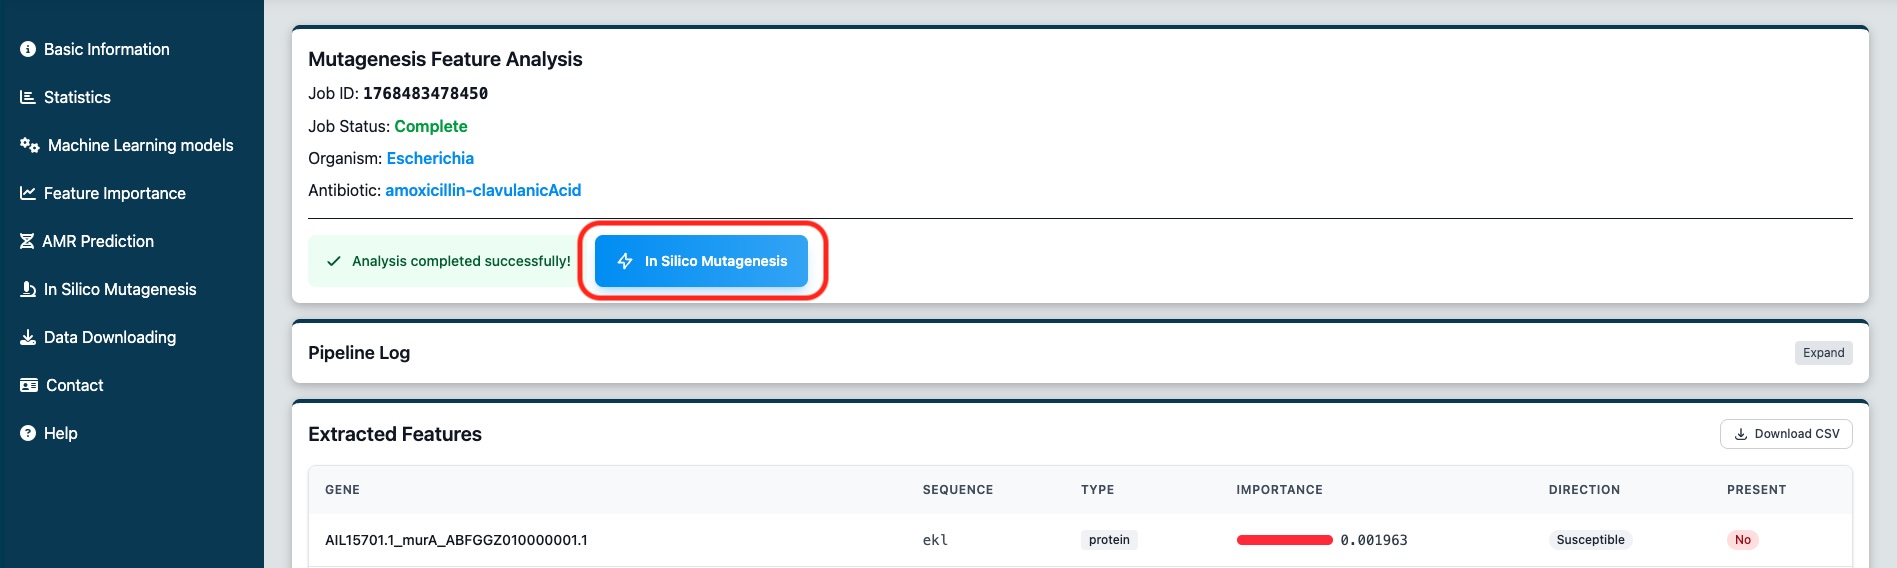
Figure 7: The first results page. You can select to modify features and run again the predictions
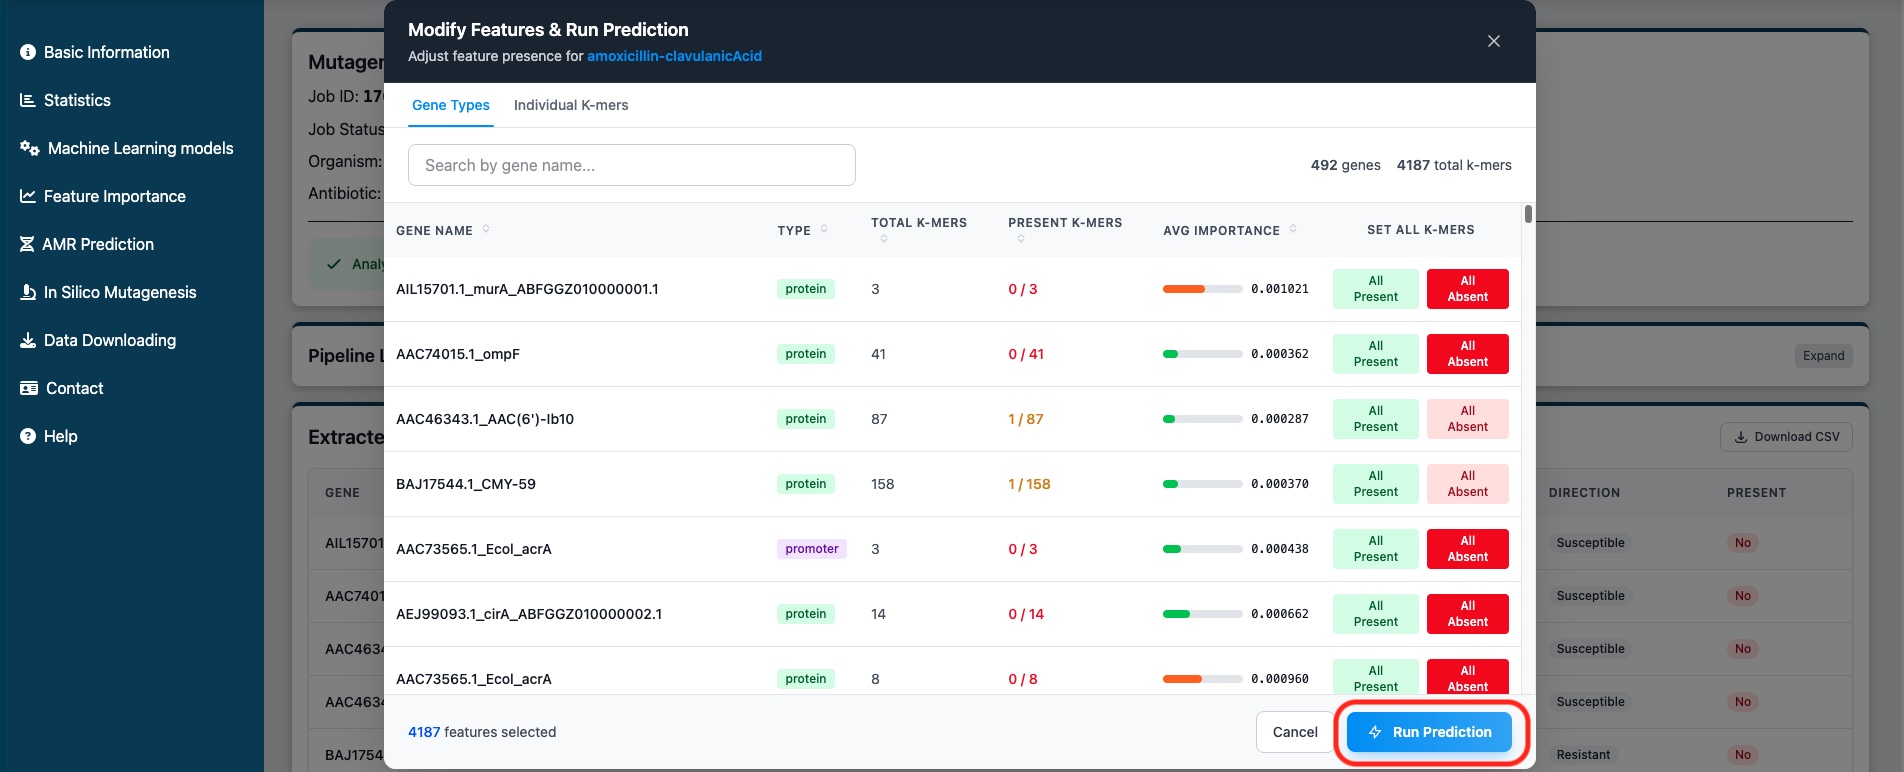
Figure 8: Modal to modify features and run predictions
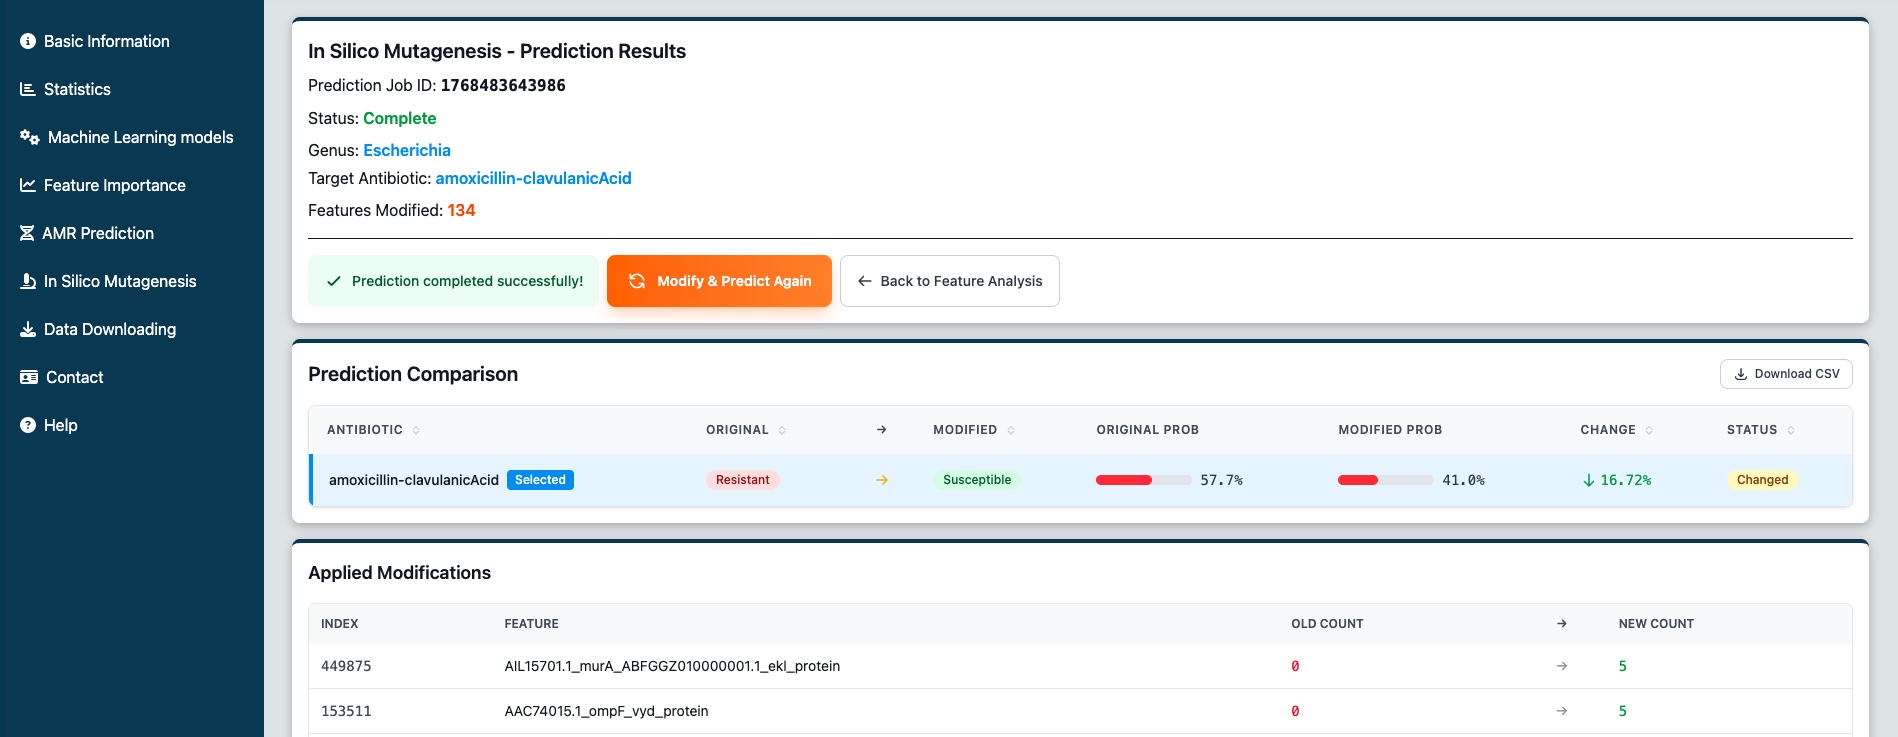
Figure 9: The new mutagenesis results page showing the comparison table. In this example, the resistance prediction changed to susceptible after modifications.

Figure 10: The cummulative modifications section showing which features were changed. We can make further modifications and click the initial modifications to see the previous state.
Interpreting Mutagenesis Results
After running a prediction with modified features, you'll see a comparison table showing how your changes affected the predictions for all antibiotics available for that genus.
Comparison Table Columns
Understanding Probability Changes
Your changes made the isolate more likely to be resistant
Your changes made the isolate more likely to be susceptible
Applied Modifications
Below the comparison table, you'll see an "Applied Modifications" section showing exactly which features were changed:
- Index - Feature index number
- Feature - The k-mer or gene name
- Old Count → New Count - Shows 0 (absent) or 5 (present)
Use Cases & Applications
Gene Importance Analysis
Determine which genes are most important for resistance by simulating their removal. High-importance genes that flip predictions when removed are strong candidates for targeted interventions.
Resistance Mechanism Exploration
Explore "what if" scenarios: What if a known resistance gene were absent? What if a protective gene were present? Understand the model's reasoning and identify key genomic drivers.
Target Prioritization
Prioritize genes for experimental validation by identifying which features have the highest impact on predictions. Focus wet-lab efforts on the most promising targets.
Educational Tool
Demonstrate the relationship between genotype and phenotype interactively. Show students and trainees how specific genetic features contribute to antimicrobial resistance predictions.
Troubleshooting
AMR Prediction Issues
❌ File upload fails
Ensure your file is in FASTA format and is under 100 MB. Check that the file extension is .fna, .fasta, or .fa.
❌ Analysis takes too long
Large genomes may take longer to process. Try disabling SHAP analysis for faster results. If the job seems stuck, check the log for error messages.
❌ Low confidence predictions
Low confidence may indicate that the isolate is genetically different from the training data, or that the assembly quality is poor. Consider re-assembling your genome with stricter quality parameters.
❌ Wrong genus selected
If you accidentally selected the wrong genus, you'll need to start a new analysis. Cancel the current job and submit a new one with the correct genus.
In Silico Mutagenesis Issues
❌ Antibiotic dropdown is empty
Make sure you've selected a genus first. The antibiotic options are genus-specific and will only appear after a genus is selected.
❌ "Start Analysis" button is disabled
Ensure all three required fields are complete: (1) a FASTA file has been uploaded and shows "File ready", (2) a genus is selected, and (3) an antibiotic is selected. All three are required to start the analysis.
❌ No features extracted
This may occur if the uploaded genome is very short, corrupted, or contains non-DNA characters. Verify your FASTA file contains valid DNA sequences with standard nucleotides (A, T, G, C).
❌ Prediction shows no change after modifications
Some features may have minimal impact on predictions, especially if they have low importance scores. Try modifying features with higher importance values or modify multiple related features (e.g., all k-mers in a gene) for a more noticeable effect.
❌ "Run Prediction" shows error
Make sure you've actually modified at least one feature. The modal shows the count of modified features in the footer. If it shows "0 modified", toggle at least one feature's presence before running the prediction.
Still need help?
If you encounter any issues or have questions not covered in this guide, please contact our support team.
Contact Support