|
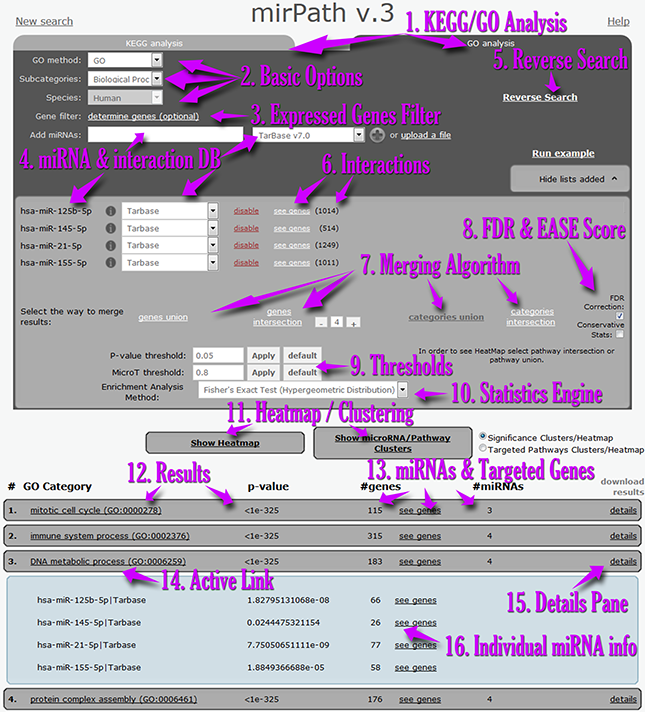
| | | In the next screenshot you can find a demonstration of the most important controls of the mirPath v.3 interface:

| | |
| | 2. Using files for Search | | |
| | mirPath v.3 can accept miRNA lists in the form of a text file. Entries should be miRNA names (miRBase 18+ nomenclature)
or miRNA MIMAT IDs, each in a new line. Method can be specified after each miRNA identifier using a delimeter '|'.
eg: hsa-let-7a|Tarbase (default method used microT-CDS)
In the image to the right you can see the format of a sample file:
| 
|
| | |
| |
- Users can perform miRNA functional analyses in real-time using KEGG or Gene Ontology annotations[1].
- Basic options[2] can be utilized to select the species or annotation subset to be included in the analysis.
- Users can restrain the interactions and statistics only to an expressed genes subset which can be uploaded using the optional Expressed genes filter menu[3].
- Each miRNA and interactions dataset can be entered individually or by using a set up file[4].
- Following the selection of miRNAs, further information regarding identified interactions and the targeted genes is presented in the miRNA matrix[6].
- DIANA-miRPath v3.0 users can subsequently select the result merging algorithm[7], advanced statistics options[8], thresholds for predictions and p-values[9], as well as the main statistics engine[10].
- Options for advanced visualizations are presented below[11]. The results pane[12] shows information regarding targeted pathways/enriched GO categories, p-values, as well as the number of miRNAs and genes present in each term[13].
- All links are active and lead to further information[14].
- The details pane[15] offers information for each miRNA, individual targets and p-values[16].
| | |
| |
Genes Union
This option first calculates the union of targeted genes by the selected microRNAs (UNION_SET: all genes targeted by at least one selected miRNAs). The UNION_SET set is used for the overrepresentation statistical analysis. This enrichment analysis identifies pathways significantly enriched with genes belonging to the UNION_SET. This is an A Priori Analysis Method.
Genes Intersection
In this analysis, the intersection of targeted genes (INTERSECTION_SET: genes targeted by all selected miRNAs) is calculated for the overrepresentation statistical analysis. The enrichment analysis identifies pathways significantly enriched in genes from INTERSECTION_SET. The user has the option to modify inclusion criteria to the INTERSECTION_SET by using the relevant dial on right. With this dial the user can select the minimum number of microRNAs required to target a gene, instead of all selected microRNAs (predefined option).
For example, if the user selects 10 microRNAs, the server will calculate the INTERSECTION_SET using the default option. In this set, only the genes targeted by all 10 microRNAs will be included. In cases of large numbers of microRNAs, the INTERSECTION_SET will probably be very small. By using the relevant dial, the user has the option to define the minimum number of required microRNAs (less than 10 in this case). The INTERSECTION_SET is now defined as the set of genes targeted by a number of miRNAs larger or equal to the user defined threshold. For example, by selecting 5 as a threshold, all genes targeted by at least 5 microRNAs will be included to the INTERSECTION_SET (instead of 10). This is an A Priori Analysis Method.
| | |
| | Pathways/Categories Union
In this mode, the server identifies all the significantly targeted pathways by the selected microRNAs. The server initially performs the enrichment analysis and calculates the significance levels (p-values) between each miRNA and every pathway. Subsequently, for each pathway a merged p-value is extracted by combining the previously calculated significance levels, using Fisher’s meta-analysis method. The resulting p-value depicts 1 - the probability that the examined pathway is significantly enriched with gene targets of at least one selected microRNA. In other words, the merged p-values signify if a particular pathway is targeted by at least one miRNA out of the initially selected group. This is an A Posteriori Analysis Method.
Pathways/Categories Intersection
This option provides the intersection of targeted pathways by the selected microRNAs. The resulting subset contains only pathways with statistically significant results for all the selected microRNAs. Significance levels are calculated as in the Pathways Union Analysis. In this option only pathways significantly targeted by all selected microRNAs are included. For example, if a pathway is not significantly targeted by one or more microRNAs, then this specific pathway will not be included in the merging step of the analysis. An A Posteriori Analysis Method. | | |
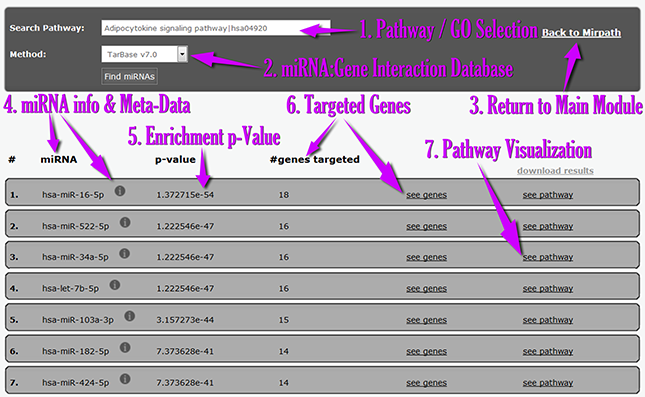
| | | In the next screenshot you can find an explanation of the Reverse Search Module Interface: |
 | |
- From the new interface, users can select the pathway/GO category of interest[1] and the interactions database[2].
- The Reverse search module presents miRNAs[4], enrichment p-values[5] and targeted genes[6].
- The links and icons of miRNAs and genes are active and lead to further information and metadata.
- The pathway visualization link[7] leads to a KEGG pathway map depicting the selected pathway, as well as the miRNA targets with a special color notation.
|
| | |
| | DIANA-miRPath v3.0 extends the Fisher's Exact Test, EASE score and False Discovery Rate methodologies , with the use of unbiased empirical distributions.
In brief, the algorithm samples without replacement from the set of all annotated miRNAs and extracts an empirical p-value, based on the proportion of simulations that produces an equal or greater KEGG/GO pathway/term overlap. The use of empirical distributions has been shown to change the scope of testing from gene level back to miRNA level and is robust against statistical biases present in GO or KEGG annotations.
DIANA-miRPath v3.0 extends this testing methodology with its meta-analysis statistics for the assessment of combined miRNA action. The meta-analysis algorithm enables the identification of pathways controlled by multiple miRNAs by examining each miRNA individually and subsequently combining the result probabilities and test statistics, as in meta-analysis studies.
This approach avoids the aforementioned pitfalls, while promoting pathways which are targeted concurrently by multiple miRNAs.
The statistics engine is highly customizable, depending on user needs. For instance, the user of DIANA-miRPath v3.0 can select between standard or robust statistics, combine results in gene (genes union or intersection) or pathways level (pathways union/intersection) in order to meet the specific requirements encountered in different research settings (e.g. exploratory vs focused functional analyses).
| | |
| |
| |

